#99: Inspiring Inquiry: 25 Fieldwork Reasons, Techniques and Investigations (GA Conference 2025)
- Wen Xin Ng

- Aug 17, 2025
- 13 min read
The Geographical Association’s 25 examples of great Reasons to Do Fieldwork poster is a great reminder of why it’s worth taking learning beyond the classroom.

Fieldwork makes it real. Geography is a living subject, played out in real-time, with content that is constantly evolving. Therefore, there is no better way of understanding its complexity than going out into the field to see, hear, feel, smell and taste it all happening at once. Heighten your senses, and get outside!
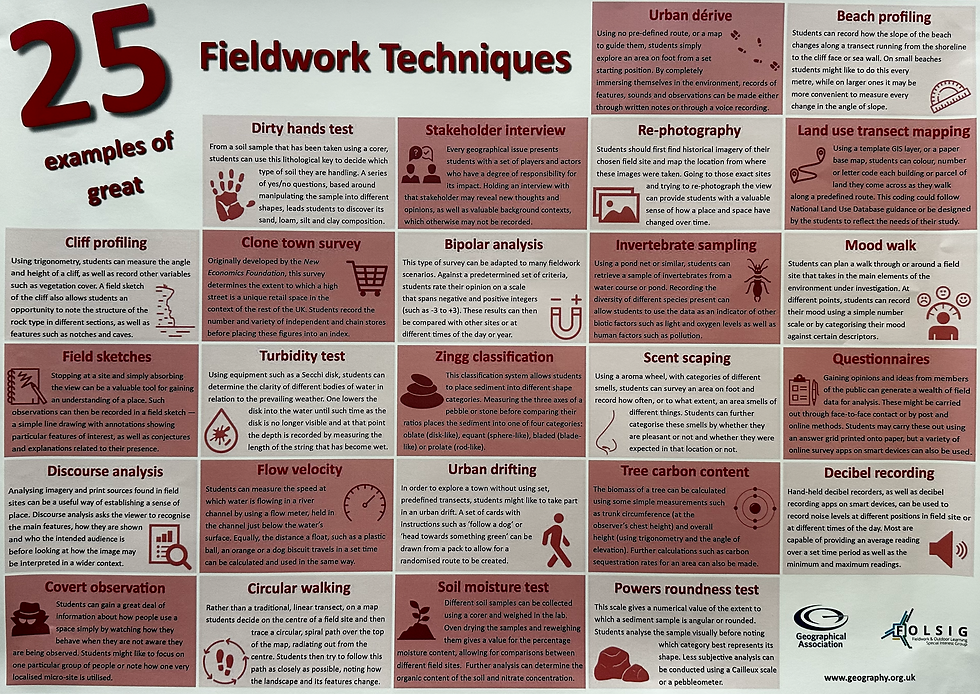
They’ve also put together 25 examples of great Fieldwork Techniques and 25 examples of great Fieldwork Investigations that are packed with ideas for exploring different environments.
Below, you’ll find the techniques and investigations grouped by topic or geographical concept. This way, you can quickly pick out what's relevant for your T&L and see at a glance how each technique/investigation can enrich your students’ learning.
Geographical Concepts
Space 🗺️
Focus: Location, spatial patterns, and how features are arranged or distributed.
🗺️ | Land use transect mapping Mapping spatial patterns and land uses. | Using a template GIS layer,or a paper base map, students can colour, number or letter code each building or parcel of land they come across as they walk along a predefined route. This coding could follow National Land Use Database guidance or be designed by the students to reflect the needs of their study. |
🌀 | Circular walking Analysing spatial variation through a structured spatial path. | Rather than a traditional, linear transect, on a map students decide on the centre of a field site and then trace a circular, spiral path over the top of the map, radiating out from the centre. Students then try to follow this path as closely as possible, noting how the landscape and its features change. |
🏬 | Clone town survey Identifying retail spatial patterns and uniqueness. | Originally developed by the New Economics Foundation, this survey determines the extent to which a high street is a unique retail space in the context of the rest of the UK. Students record the number and variety of independent and chain stores before placing these figures into an index. |
📸 | Re-photography Comparing spatial arrangement over time. | Students should first find historical imagery of their chosen field site and map the location from where these images were taken. Going to those exact sites and trying to re-photograph the view can provide students with a valuable sense of how a place and and space have changed over time. |
⚖️ | Bipolar analysis Evaluating characteristics across space (e.g. site comparison). | This type of survey can be adapted to many fieldwork scenarios. Against a predetermined set of criteria, students rate their opinion on a scale that spans negative and positive integers (such as from -3 to +3). These results can then be compared with other sites or at different times of the day or year. |
🔊 | Decibel recording Comparing spatial variation in noise levels. | Hand-held decibel recorders, as well as decibel recording apps on smart devices, can be used to record noise levels at different positions in field site or at different times of the day. Most are capable of providing an average reading over a set time period as well as the minimum and maximum readings. |
Place 📍
Focus: Meaning, perceptions, and emotional/sensory experiences of a place.
🧭 | Urban dérive Exploring personal encounters with place. | Using no pre-defined route, or a map to guide them, students simply explore an area on foot from a set starting position. By completely immersing themselves in the environment, records of features, sounds and observations can be made either through written notes or through a voice recording. |
🙂 | Mood walk Capturing place-based emotional responses. | Students can plan a walk through or around a field site that takes in the main elements of the environment under investigation. At different points, students can record their mood using a simple number scale or by categorising their mood against certain descriptors. |
👃🏻 | Scent scaping Exploring the sensory atmosphere of a place. | Using an aroma wheel, with categorises of different smells, students can survey an area on foot and record how often, or to what extent, an area smells of different things. Students can further categorise these smells by whether they are pleasant or not and whether they were expected in that location or not. |
✏️ | Field sketches Observing and interpreting place characteristics. | Stopping at a site and simply absorbing the view can be a valuable tool for gaining an understanding of a place. Such observations can then be recorded in a field sketch – a simple line drawing with annotations showing particular features of interest, as well as conjectures and explanations related to their presence. |
📰 | Discourse analysis Analysing signage and media that construct place identity. | Analysing imagery and written sources found in field sites can be a useful way of establishing a sense of place. Discourse analysis asks the viewer to recognise the main features, how they are shown, and who the intended audience is before looking at how the image may be interpreted in a wider context. |
🚶 | Urban drifting Exploring personal encounters with place. | In order to explore a town without using set, predefined transects, students might like to take part in an urban drift. A set of cards with instructions such as 'follow a dog' or 'head towards something green' can be drawn from a pack to allow for a randomised route to be created. |
Environment 🕵🏻
Focus: Human-environment interaction and its impacts.
🕵🏻 | Covert observation Studying how people use and impact environments. | Students can gain a great deal of information about how people use a space simply by watching how they behave when they are not aware they are being observed. Students might like to focus on one particular group of people or note how one very localised micro-site is utilised. |
🗣 | Stakeholder interview Capturing human perspectives on environmental change or issues. | Every geographical issue presents students with a set of players and actors who have a degree of responsibility for its impact. Holding an interview with that stakeholder may reveal new thoughts and opinions, as well as valuable background contexts, which otherwise may not be recorded. |
📋 | Questionnaire Uncovering perceptions of and interactions with the environment. | Gaining opinions and ideas from members of the public can generate a wealth of field data to enrich analysis. These might be carried out through face-to-face contact or by post and other methods. Students may carry these out by using an answer grid printed onto paper, but a variety of online survey apps on smart devices can also be used. |
Scale ⏳
Focus: Temporal or spatial scale – how features or processes vary across time or size.
📸 | Re-photography (also under Space) Visualising change across time. | Students should first find historical imagery of their chosen field site and map the location from where these images were taken. Going to those exact sites and trying to re-photograph the view can provide students with a valuable sense of how a place and and space have changed over time. |
🌀 | Circular walking (also under Space) Spatial scale of landscape analysis. | Rather than a traditional, linear transect, on a map students decide on the centre of a field site and then trace a circular, spiral path over the top of the map, radiating out from the centre. Students then try to follow this path as closely as possible, noting how the landscape and its features change. |
⚖️ | Bipolar analysis (also under Space) Allows for comparison across scales (e.g. site, neighbourhood). | This type of survey can be adapted to many fieldwork scenarios. Against a predetermined set of criteria, students rate their opinion on a scale that spans negative and positive integers (such as from -3 to +3). These results can then be compared with other sites or at different times of the day or year. |
Topics
Forests 🌳 / Climate 🌬️
🌳 | Tree carbon content Calculating tree biomass to estimate stored carbon and sequestration rates. | The biomass of a tree can be calculated using some simple measurements such as trunk circumference (at the observer's chest height) and overall height (using trigonometry and the angle of elevation). Further calculations such as carbon sequestration rates for an area can also be made. |
🖐️ | Dirty hands test Identifying soil composition to understand soil characteristics and their influence on vegetation and land use. | From a soil sample that has been taken using a corer, students can use this lithological key to decide which type of soil they are handling. A series of yes/no questions, based around manipulating the sample into different shapes, leads students to discover its loam, sand, silt and clay composition. |
Water 💧
💧 | Turbidity test Measuring water clarity to assess sediment levels and environmental conditions. | Using equipment such as a Secchi disk, students can determine the clarity of different bodies of water in relation to the prevailing weather. One lowers the disk into the water until such time as the disk is no longer visible and at that point the depth is recorded by measuring the length of the string that has become wet. |
🪰 | Invertebrate sampling Identifying aquatic biodiversity to indicate water quality and ecosystem health. | Using a pond net or similar, students can retrieve a sample of invertebrates from a water course or pond. Recording the diversity of different species present can allow students to use the data as an indicator of other biotic factors such as light and oxygen levels as well as human factors such as pollution. |
🌱 | Soil moisture test Determining moisture content for comparison of soil conditions across sites and for drawing links to infiltration/runoff. | Different soil samples can be collected using a corer and weighed in the lab. Oven drying the sample and reweighing them gives a value for the percentage moisture content, allowing for comparisons between different field sites. Further analysis can determine the organic content of the soil and nitrate concentration. |
🏞️ | Flow velocity Measuring the speed of water flow to understand river dynamics and processes. | Students can measure the speed at which water is flowing in a river channel by using a flow meter, held in the channel just below the water's surface. Equally, the distance a float, such as a plastic ball, an orange or a dog biscuit, travels in a set time can be calculated and used in the same way. |
Coasts 🏖️
🏖 | Beach profiling Recording beach slope changes along a transect to analyse coastal processes. | Students can record how the slope of the beach changes along a transect running fro the shoreline to the cliff face or sea wall. On small beaches students might like to do this every metre, while on larger ones it may be more convenient to measure every change in the angle of slope. |
📐 | Cliff profiling Measuring cliff angles and heights to study structure, vegetation and erosional features. | Using trigonometry, students can measure the angle and height of a cliff, as well as record other variables such as vegetation cover. A field sketch of the cliff also allows students an opportunity to note the structure of the rock type in different sections, as well as features such as notches and caves. |
🪨 | Zingg classification Categorising sediment shapes to interpret transport history and depositional environment. | This classification system allows students to place sediment into different shape categories. Where rounded, the sample (typically pebbles) is classified into a ratio. These ratios places the sediment into one of four categories: equant (sphere-like), bladed (blade-like) or prolate (rod-like). |
🟤 | Powers roundness test Assessing sediment roundness to infer erosion, transport and depositional processes. | This scale gives a numerical value of the extent to which a sediment sample is angular or rounded. Students analyse the sample visually before noting which category best represents its shape. Less subjective analysis can be conducted using a Cailleux scale or a pebbleometer. |

Topics
Water 💧
💧 | Variation in water pollution | Students can take water samples periodically along a river and test them using simple phosphate or nitrate strips. This research may reveal areas of both high and low pollution which can be mapped against other observations like land use (such as arable farming) and aquatic vegetation (such as reed beds). |
📈 | Infiltration rate changes | Students can research the extent to which geology and soil structure influence precipitation run off and the depth of ground water levels by identifying soil from samples and by carrying out a series of infiltration surveys. Students can also map land use to see how that can also slow or quicken the rate of infiltration. |
🏞️ | River characteristics | Once they have learnt and understood the Bradshaw Model, students can undertake a wide variety of river measurements to test whether its predictions are true in the real world. Placing the numerical data into a GIS software package can then allow students to visualise the way a river changes from source to mouth. |
Sustainable Cities 🏙️
🌳 | Resource extraction | By completing a land use survey and landscape analysis survey, students can establish whether the extraction of a particular resource (such as gravel or water) has contributed to the social character of an area as well as the extent to which it has changed the area’s attractiveness. |
♿︎ | Social access to retail space | Students who use wheelchairs or mobility aids are well placed to investigate whether public spaces have been designed with their needs in mind. Students can map transects radiating out from a central retail point and see how far they can travel before the design of the space hinders them. |
🚓 | Crime and urban planning | Students can map a range of crime reducing strategies around their local town such as CCTV, mirrored walls, street lighting and neighbourhood watch schemes. Undertaking a mood survey as they wander through the town can then reveal how urban planning has affected their feelings about the place. |
🏙️ | Sustainable transport plans | Students can map a town's various transport hub in terms of their position and which areas they serve. Students can then rate the different options open to visitors and residents against sustainability criteria and develop a future plan for the area which they can then put to local people and business owners. |
🔋 | Food vs. energy farming | Students can investigate the rise of energy farms in their local areas and through stakeholder interviews discover why some land owners have moved to this type of farming. A sphere of influence study can be conducted to see at what distane people both benefit and/or suffer as a result of their development. |
🏘 | Settlement hierarchies | Students can identify a series of settlements in their local area that in theory should match the different levels of the settlement hierarchy. Students can then research the level of goods available as well as service provision in those settlements to see if the traditional model of hierarchy is true in that area. |
🌍 | Indicators of globalisation | Students can develop a set of criteria for measuring levels of globalisation based around the KOF Index. Through a combination of primary and secondary research, students can then rank different places according to these criteria and hypothesise why places show variation in globalisation. |
🏨 | New build developments | Students can carry out a cost-benefit analysis of the impact a new build development will have on a local area in both the long and short term. A conflict matrix may be designed following stakeholder interviews with a variety of local players such as councillors and contractors of the new build. |
🏘 | Extent of gentrification | Students can attempt to define what gentrification means by selecting measurable criteria anf seeing to what extent a variety of places 'fit' a model of gentrification. Questionnaire-based data collection can also allow students to study local perceptions of an area from both new arrivals and long term residents. |
🏭 | Deindustrialisation impacts | Through a series of focused group interviews, students can establish a narrative of deindustrialisation experiences. By coding these interviews, students can find common themes and common impacts and develop a wider picture of how deindustrialisation has affected people economically and socially. |
🛍️ | Design of retail spaces | Students can content a micro-scale stidy of their local shopping mall to look for evidence of manipulative design of the retail space. Mapping the exact position of benches, walkways, escalators, eateries and the large focal-point stores can demonstrate how our movements are controlled. |
Climate 🌬️
🌾 | Agricultural microclimates | Students can map the positioning of buildings, hedge lines, and trees against the predominant wind direction and the flow of water over the landscape. Students can then take temperature, wind and infiltration recordings at a wide variety of microsites to establish the connection between these factors. |
Tourism 🛂
🧳 | Impact of tourism | Students can compare two areas of the same geographical region: one that is thought of as well developed on the Butler Model and another that by the same model would be thought of as just starting out. They can measure the impact of tourism in both places by questioning local people and the tourists themselves. |
🧍🏻♂️ | Insider vs outsider views | Students who know an area well may like to research how their 'insider' view of it differs from that of an 'outsider'. This could cover social or environmental criteria selected by both the researcher and the outsider. A discourse analysis of secondary materials may reveal why there are differences of opinion. |
🏝️ | Regeneration success | When developing regeneration schemes, local town councils often have a mission statement or success criteria in mind. Students can use these criteria to develop an evaluation survey and gauge local public opinion, as well as that of visitors, as to how successful the entire scheme has been. |
Coasts 🏖️ / Glacial Landforms / Tropical Environments (A Levels)
🌊 | High v low energy coasts | Students can measure a variety of physical factors such as wind speed and direction as well as wave height, frequency and energy in two different types of coastlines. Students can then compare the shape and size of the beach, and the position and size of sediment in both locations to look for a connection. |
🌬️ | Sand dune succession | By collecting a variety of biotic and abiotic data (such as halophytic plant density and soil pH), students can see to what extent a model of succession is true in a real sand dune system. Where variations are found, students can map dune micro-features (such as blowouts) to see the impact these may have on the model. |
🧭 | Orientation of corries | Students can study the orientation of corries in relation to a variety of other measurable features in the field. Altitude, size and steepness of the back wall may all correlate to corrie orientation, and by looking at these various factors holistically, a wider understanding of glacier features can be gained. |
🗻️ | Variances in moraine | Students can study the size, shape and orientation of moraine in a glacial area. By building banks of such data, students can then reveal the way in which sediment was carried during glacial periods. Angularity studies can indicate to students the extent of ice contact and erosion over time. |
⛓️💥 | Causes of structural damage | Students can create a structural damage survey for buildings listing criteria in a scale from negligible to severe. They can then also measure natural observations such as prevailing wind, slope gradient, aspect and relief to find a possible physical source of the damage before investigating local economies at play. |
🛡️ | Coastal defence strategies | Students can study the effectiveness of different coastal defences in a seaside town by looking at land use and value directly behind different defences. This could be combined with a cost-benefit analysis of the defences in situ, examining their aesthetic appeal and their effectiveness though a structural survey. |
🛝 | Dynamics of a slope | Students can measure slope gradient and map areas of mass movement such as soil creep and land slips. Using GIS softwares students would be able to map and then recognise correlations between the measured data and the observed phenomena. Students may like to link this to possible land uses. |


Comments